Our forecasts and up-to-date weather information can be accessed on a wide range of end devices.
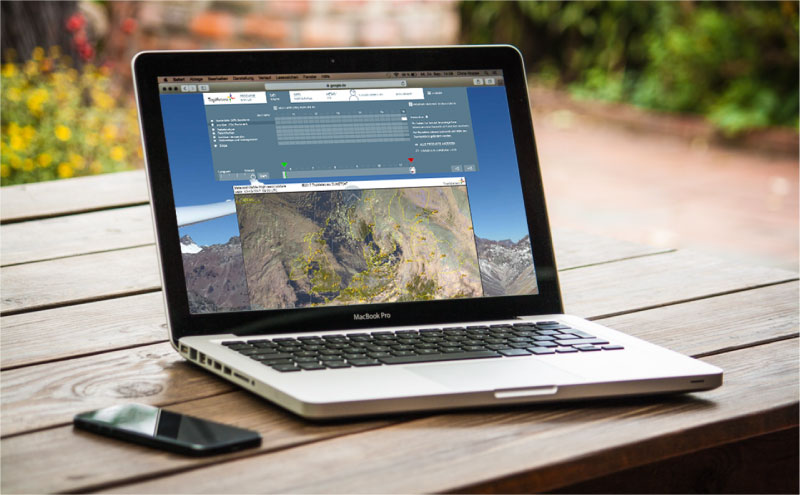
Laptop or PC - ideal for home use and advance planning
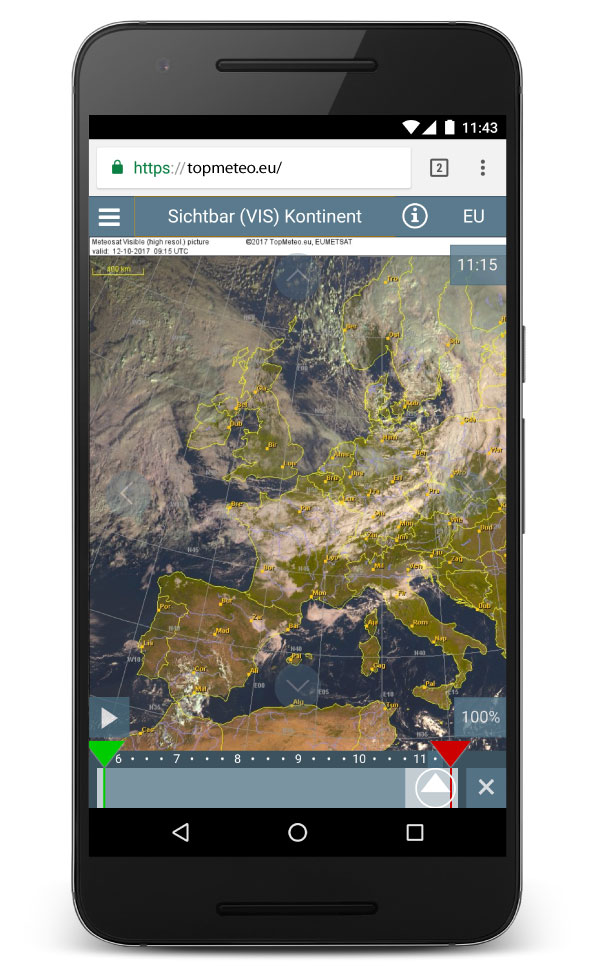
Mobile site - on the move in your browser
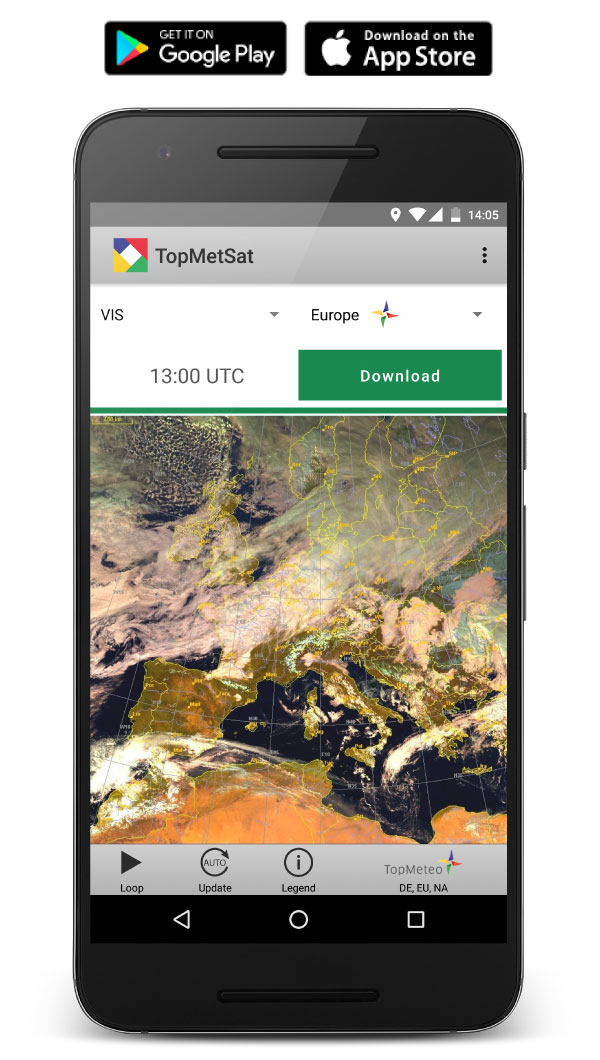
Satellite and radar images on the move and in the air - with the TopMetSat App
In the example, a VFR flight is planned within northern France (Paris to Lille) a few days before it will actually happen. To plan this flight, our key forecast maps are used, which give the pilot both a rapid and detailed impression of the weather conditions to be expected.
We start the briefing in the Forecast Mapsheader.
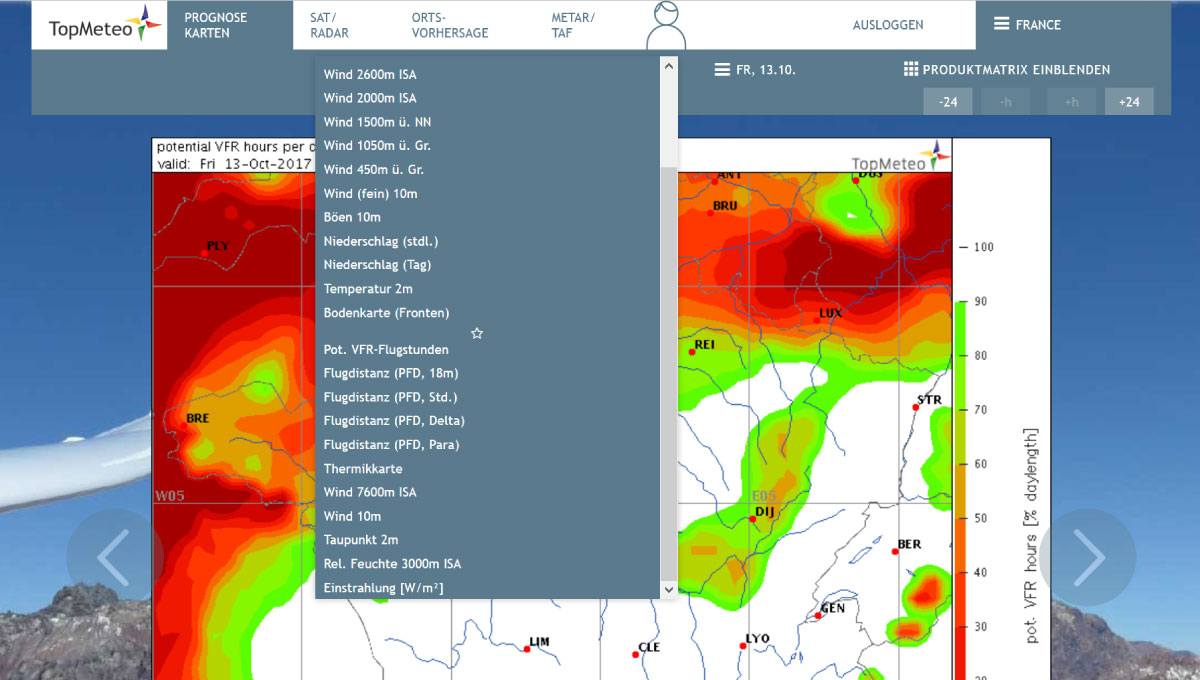
Forecast maps
First we take a look at the potential VFR flying hours. Here we obtain a quick overview of the usability of the entire day (from sunrise to sunset). Orange areas are located on our route and symbolise a VFR flyability of 60%. This means that flyable VFR conditions are available 60% of the day only. On the subsequent maps we will find out when these impediments occur and what they are.
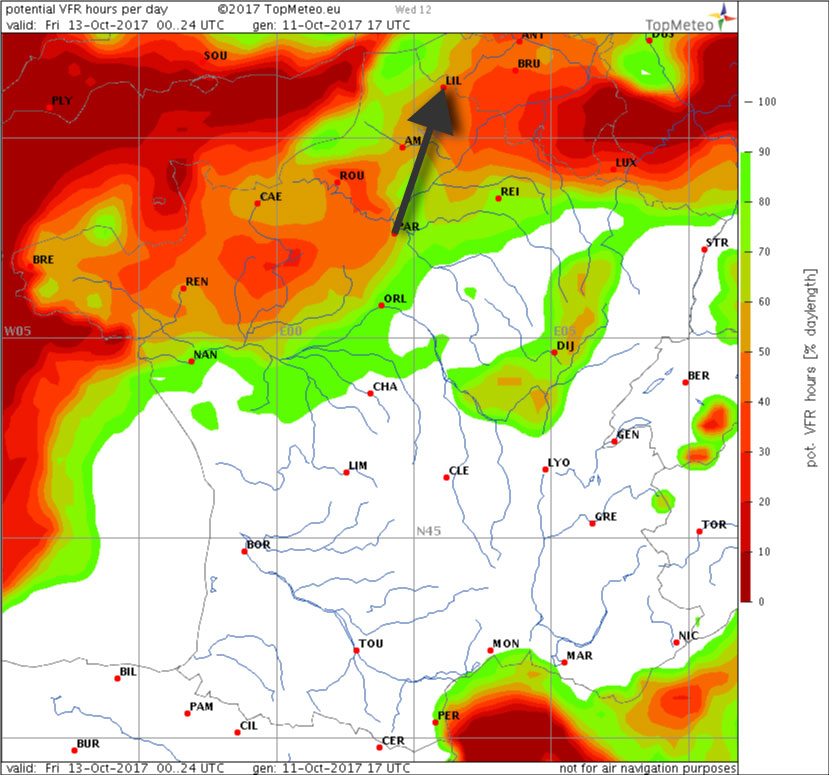
Potential VFR flight hours - the arrow symbolises the planned flight route
A quick look at the ground map shows that the advancement of a front is not expected. This is extremely helpful when assessing the weather dynamics.
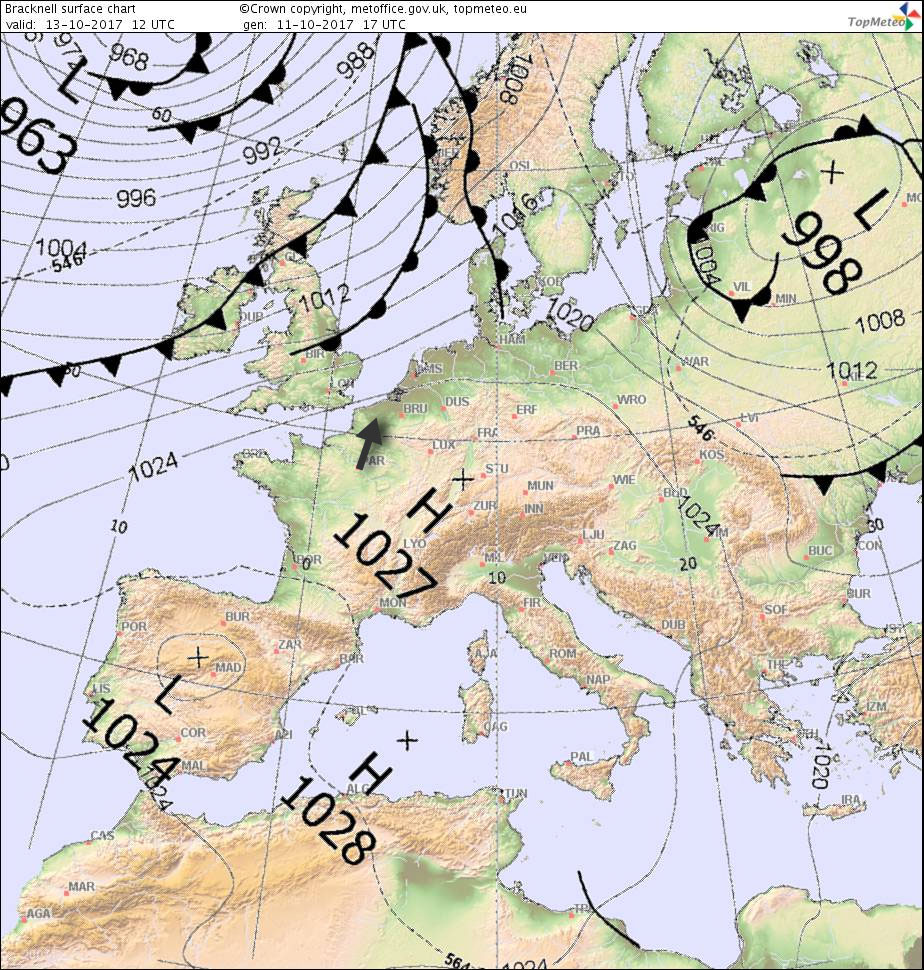
Ground map showing fronts and pressure distribution at 12 UTC
Now we can commence the hourly analysis using the Significant Weathermap. In the morning, it forecasts fog, thus no flyable VFR conditions.
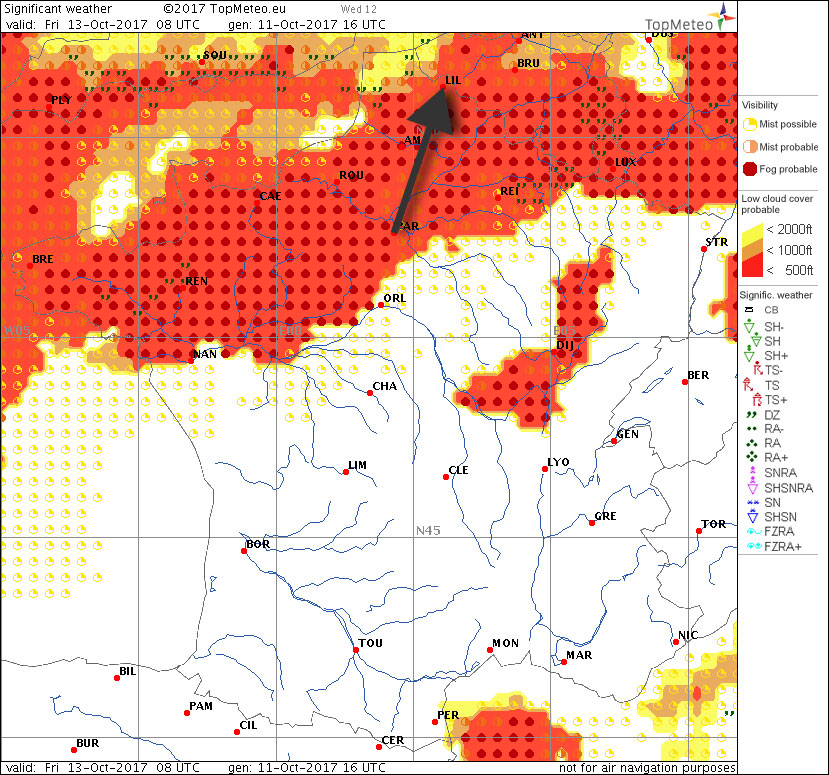
Significant weather 08 UTC
A couple of hours later the weather conditions are looking considerably better. The thick cloud cover has dispersed and visibility is good. However, as haze and fog are forecast in the area for the afternoon, this should be kept in mind.
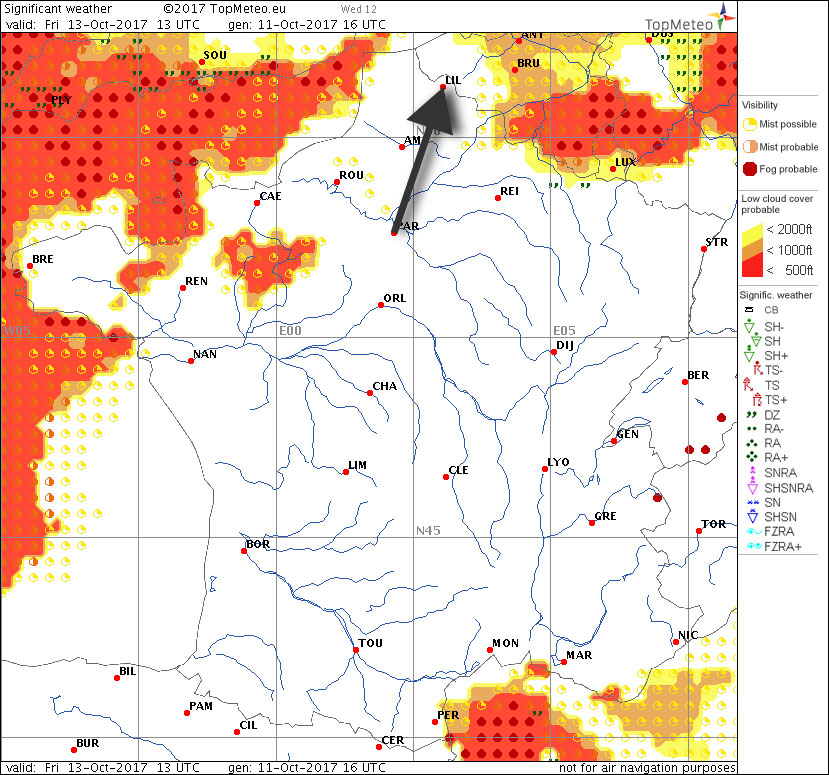
Significant weather 13 UTC
We can verify this image using the cloud distribution . In northern France there is a strip of low-lying cloud cover in the morning, which is clearly evident from the orange-coloured area.
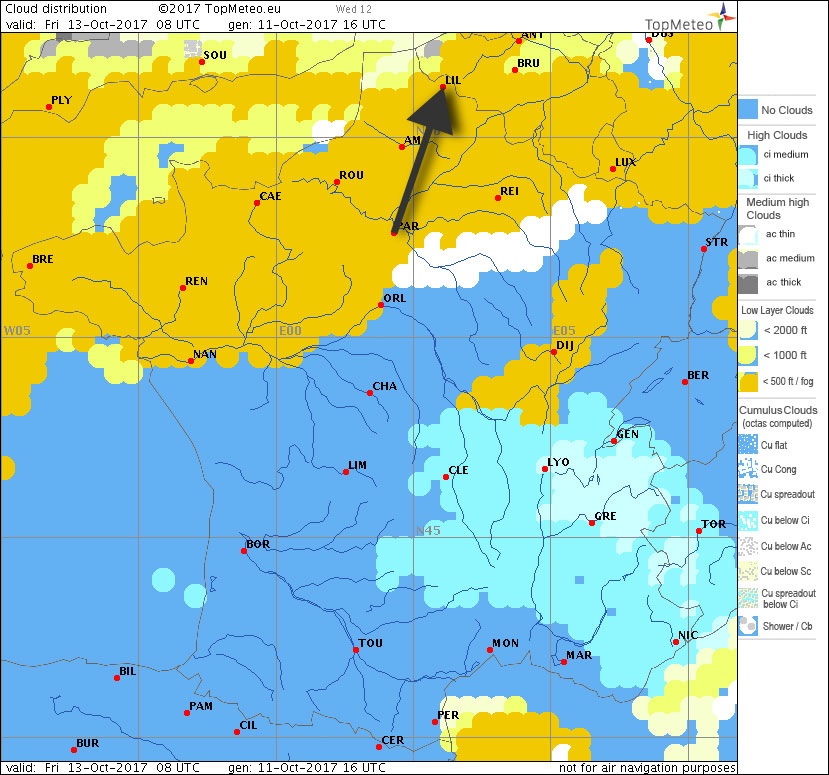
Cloud distribution 08 UTC
The low cloud cover has disappeared in the afternoon and there are only a few cumulus clouds left.
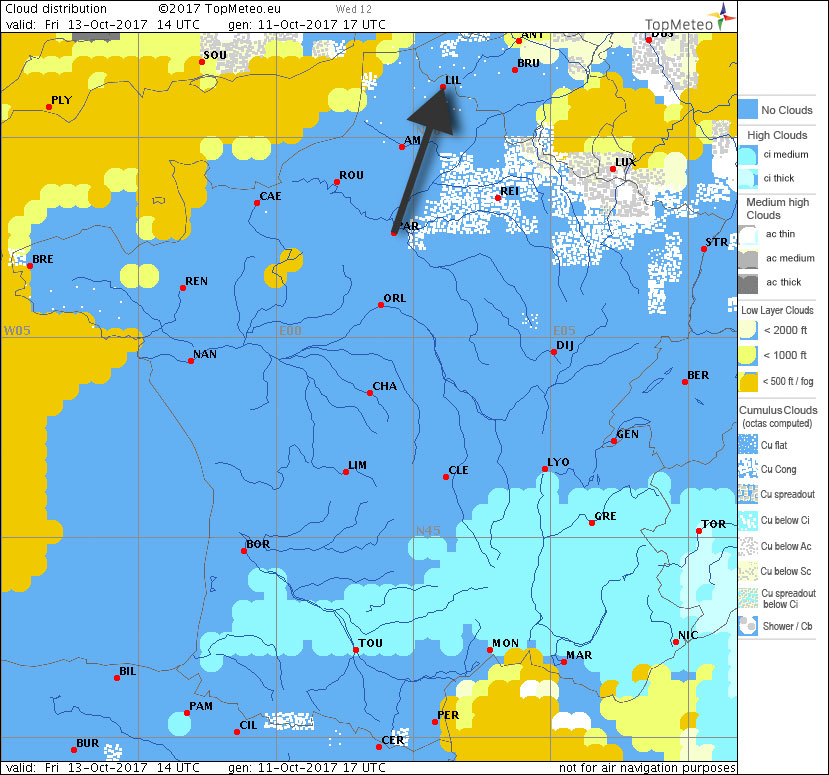
Cloud distribution 13 UTC
Then another look at the wind map. We can perform a calculation using a simple tailwind component.
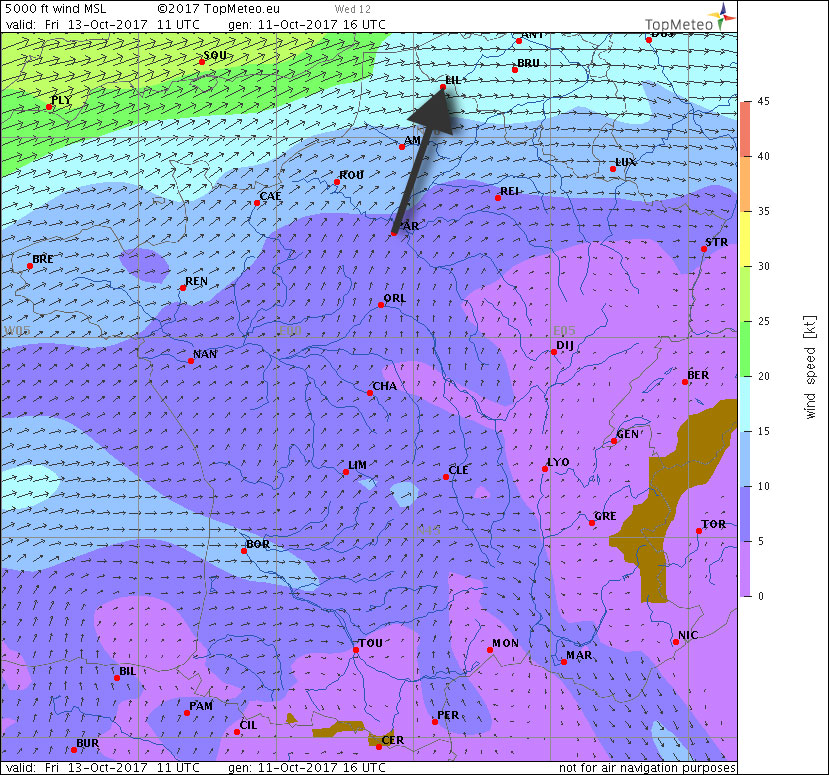
Wind 3500 ft 11 UTC
A weather briefing just before taking-off is very different to the weather briefing for a date in the future. It brings the actual weather conditions to the fore. An analysis of these conditions has priority. To do this, TopMeteo offers a wide range of satellite, radar and lightning maps. The advice below must be heeded before every single flight: A check of the current weather is mandatory prior to every take-off!
In addition to our images, it is also extremely helpful to check the latest METARs.
The classic, the visual satellite image. Ideal if you need to obtain a general impression of the cloud conditions.
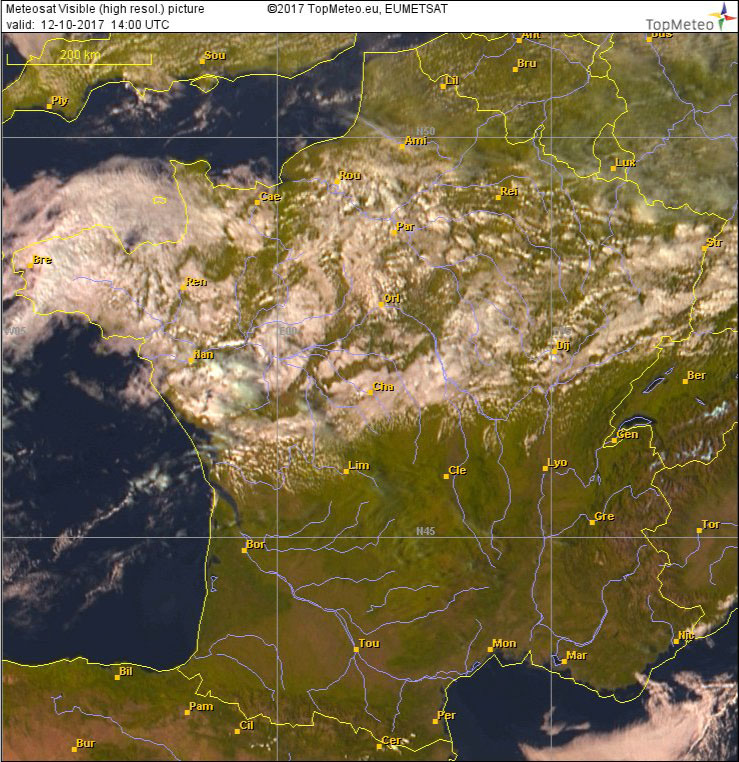
VIS
Cloud types are visible in much greater detail in the fog analysis. This analysis also looks identical at night and shows low-lying stratus and fog as yellow areas.
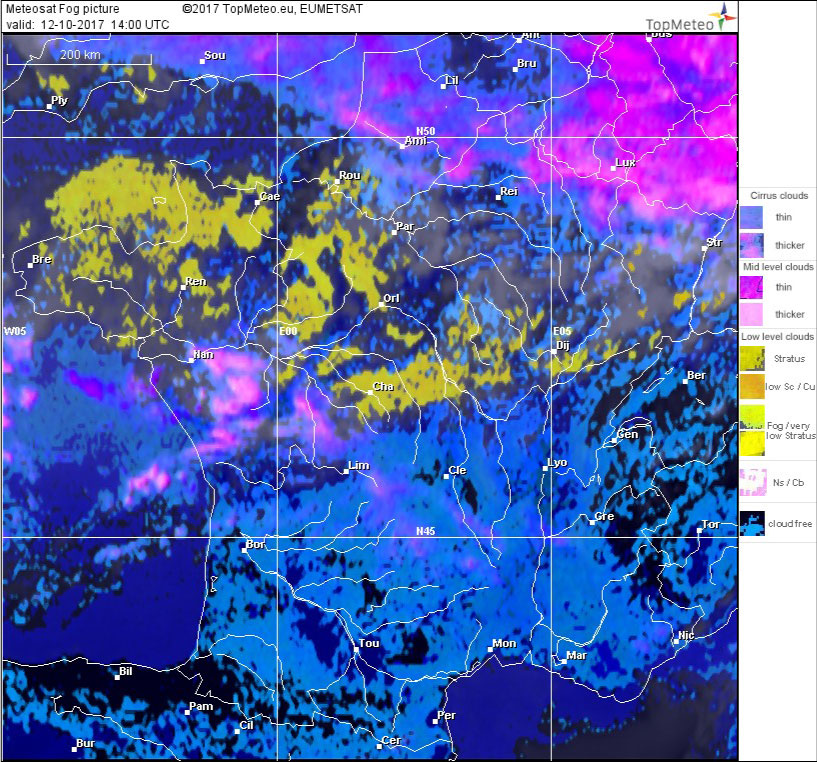
Fog analysis
An impression of the flyable altitudes is obtained from cloud tops and ceilings .
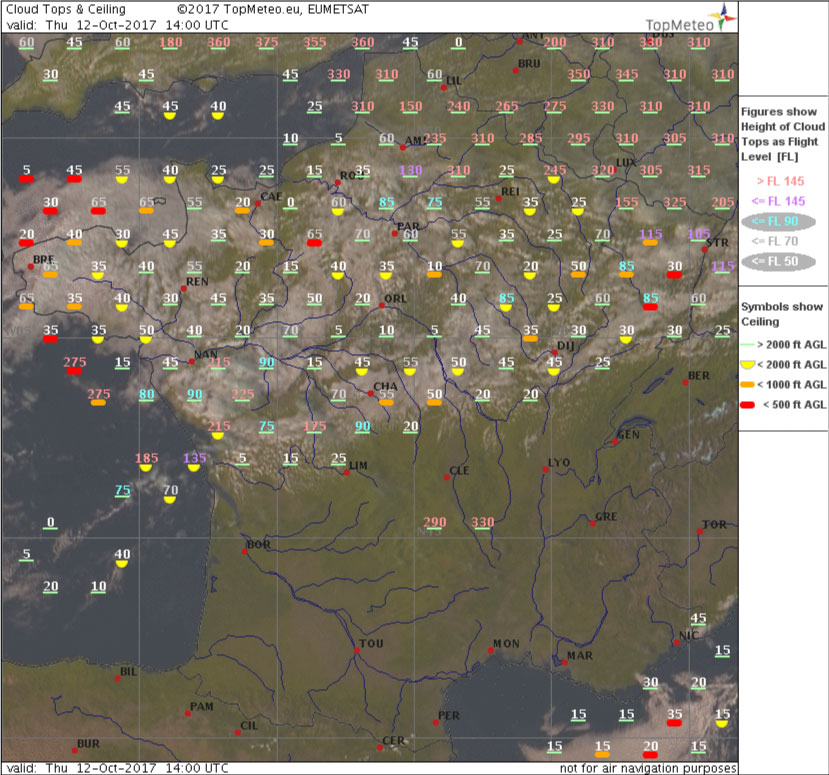
Cloud tops and ceiling
Precipitation is displayed by the weather radar.
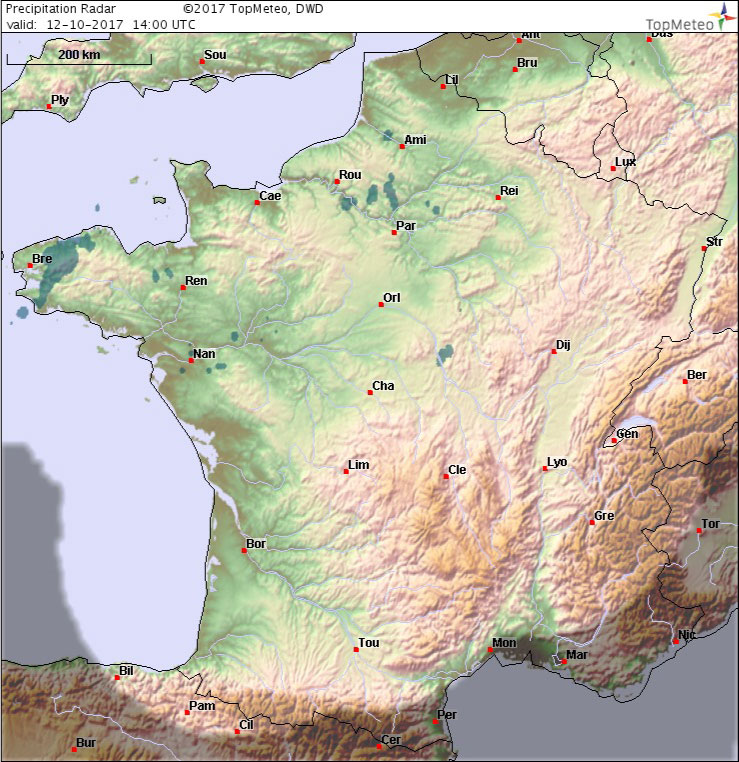
Weather radar